
What Can The Reader Reasonably Conclude From Information in The Graph?
Graphs can be powerful tools for conveying complex information in a concise and visual manner. However, they can also be misleading if not properly understood. In this article, I’ll be breaking down the key components of a graph and explaining how each element contributes to the overall message. By understanding the different types of graphs, their axes, labels, and data points, you’ll be able to navigate through the sea of information and draw accurate conclusions.
Understanding Graphs
What is a Graph?
A graph is a visual representation of data that helps convey information in a clear and concise manner. It consists of different components that provide valuable insights to the reader. By understanding the key elements of a graph, readers can draw reasonable conclusions and make informed decisions.
Types of Graphs
There are various types of graphs that are commonly used to present different types of data. Some of the most common types of graphs include:
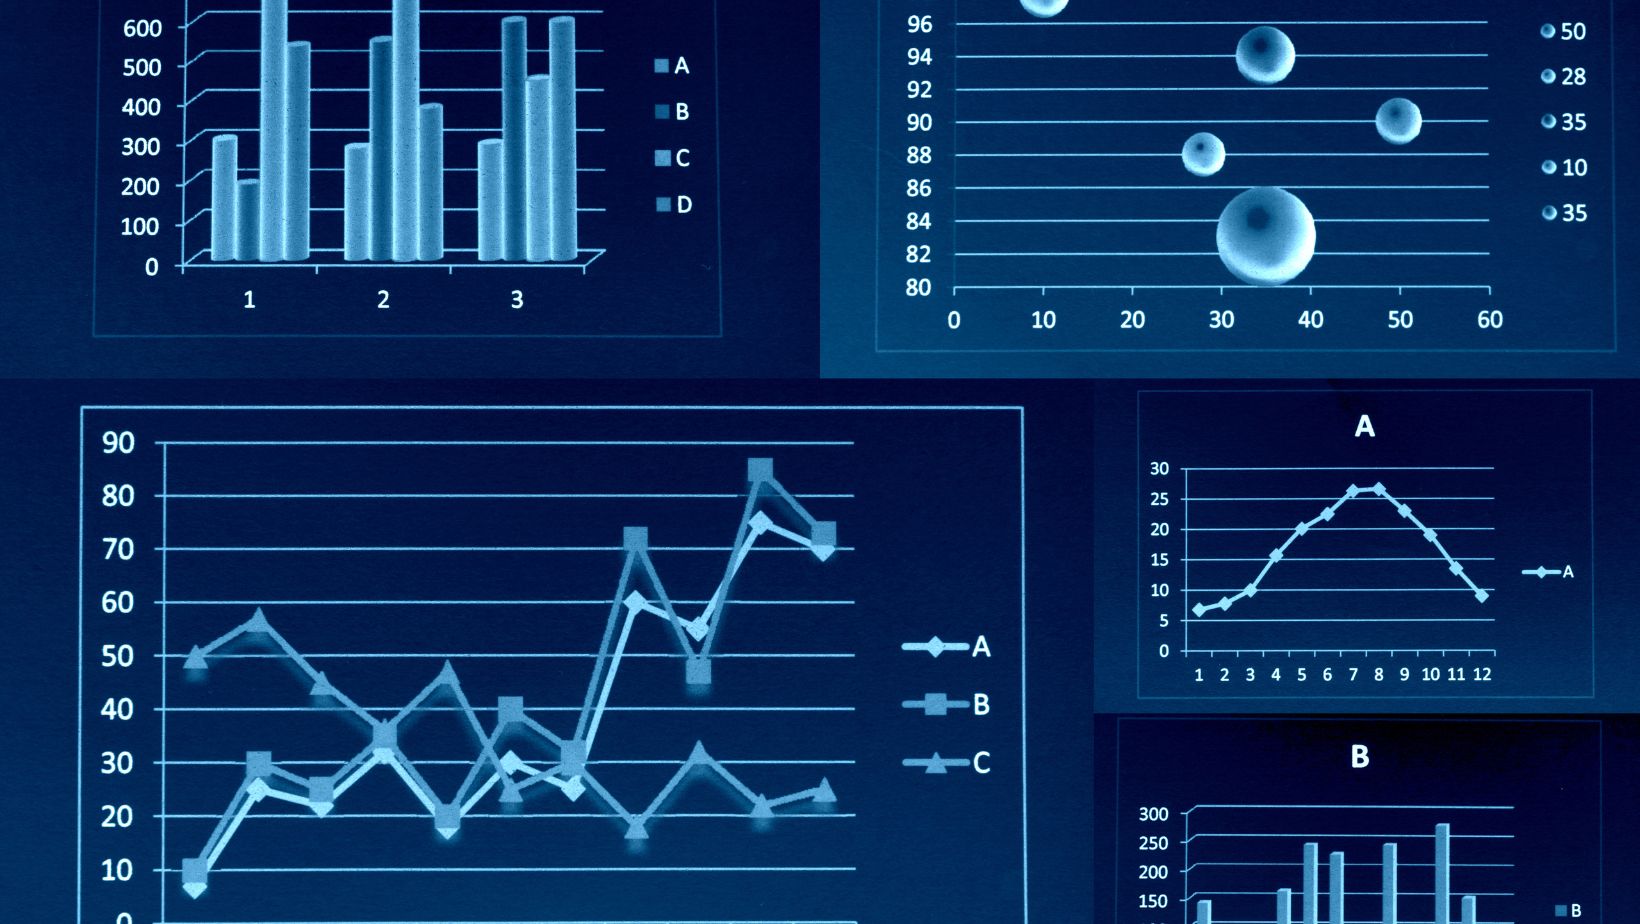
- Bar Graphs: Bar graphs use vertical or horizontal bars to represent and compare data categories. They are useful for comparing quantities or frequencies of different categories.
- Line Graphs: Line graphs show the relationship between two variables over a period of time. They are effective in displaying trends and patterns in data.
- Pie Charts: Pie charts are circular graphs that represent parts of a whole. They are ideal for illustrating percentages or proportions of different categories.
- Scatter Plots: Scatter plots display the relationship between two variables. They are helpful in identifying correlations or associations between variables.
- Histograms: Histograms are similar to bar graphs but are used to represent continuous data. They provide a visual representation of the distribution and frequency of data.
Reading And Analyzing Graphs
To draw reasonable conclusions from a graph, readers need to effectively analyze the data presented. Here are some key steps to consider when reading and analyzing graphs:
- Examine the Axes: The axes of a graph provide important context for the data. The x-axis represents the independent variable, while the y-axis represents the dependent variable. Pay attention to the scale and units used on each axis.
- Interpret the Labels: Graphs often have labels that provide additional information about the data. Read and understand the labels to gain a deeper understanding of the graph.
- Identify Data Points: Data points on a graph represent specific values or observations. Identify the data points and their corresponding values to analyze the relationships between variables.
- Look for Trends and Patterns: Analyze the overall shape and direction of the data points. Look for trends, such as increasing or decreasing patterns, and identify any outliers or unusual observations.
- Compare Data Sets: If the graph presents multiple data sets, compare them to identify similarities or differences. Look for patterns or relationships between the data sets.
 Interpreting Data From Graphs
 Interpreting Data From Graphs
Identifying Key Trends
When interpreting data from graphs, one of the most important tasks is to identify key trends. By analyzing the patterns and changes in the data points, the reader can gain valuable insights and draw reasonable conclusions. Here are some strategies to help identify these trends:
- Look for overall patterns: Examine the general direction of the data. Are the values increasing, decreasing, or staying relatively constant over time or across different categories? This can provide valuable information about the trend being represented.
- Identify peak points and outliers: Pay attention to any points that stand out from the overall pattern. These peaks or outliers can indicate significant events, exceptional cases, or anomalies that may affect the data.
- Consider the slope of the line: If the graph includes a line or curve, analyze its slope. A positive slope suggests an upward trend, while a negative slope indicates a downward trend. A flat line suggests a relatively stable or no trend.
Analyzing Relationships
Another important aspect of interpreting data from graphs is analyzing relationships between variables. This helps the reader understand how different factors are related and how changes in one variable may impact another. Here are some ways to analyze these relationships:
- Compare multiple data sets: If the graph includes multiple lines or bars representing different variables or categories, compare their patterns. Look for similarities, differences, or any correlation between the variables.
- Examine intersections and overlaps: Pay attention to points where lines or bars intersect or overlap. These points may indicate a relationship or interaction between the variables being represented.
- Consider the position on the axes: The position of data points on the graph axes can provide insights into the relationship between variables. For example, if one variable is plotted on the x-axis and another on the y-axis, the position of the data points relative to each axis can indicate a positive or negative correlation.
Conclusion
By understanding the key components of a graph, such as axes, labels, and data points, readers can draw accurate conclusions. Analyzing graphs effectively involves identifying trends and patterns, comparing data sets, and examining the axes and labels. However, it is important to consider the context, relevant data labels, and prior knowledge when making inferences from graphs. Remember, graphs are powerful tools for visualizing data, and with the right approach, readers can unlock valuable information and make well-informed decisions. So, next time you encounter a graph, apply these strategies and confidently draw conclusions from the information presented.